Skip to content

Advanced Reports & Analytics
for Data-Driven Decisions

Unlock actionable insights with comprehensive reporting and analytics tools.
Monitor performance, track metrics, and drive business growth through intelligent data visualization.

  • 14-day free trial
  • No credit card required
  • Onboarding assistance included
Decorative circular shape
Decorative triangle shape
Report Generation

REAL-TIME INSIGHTS

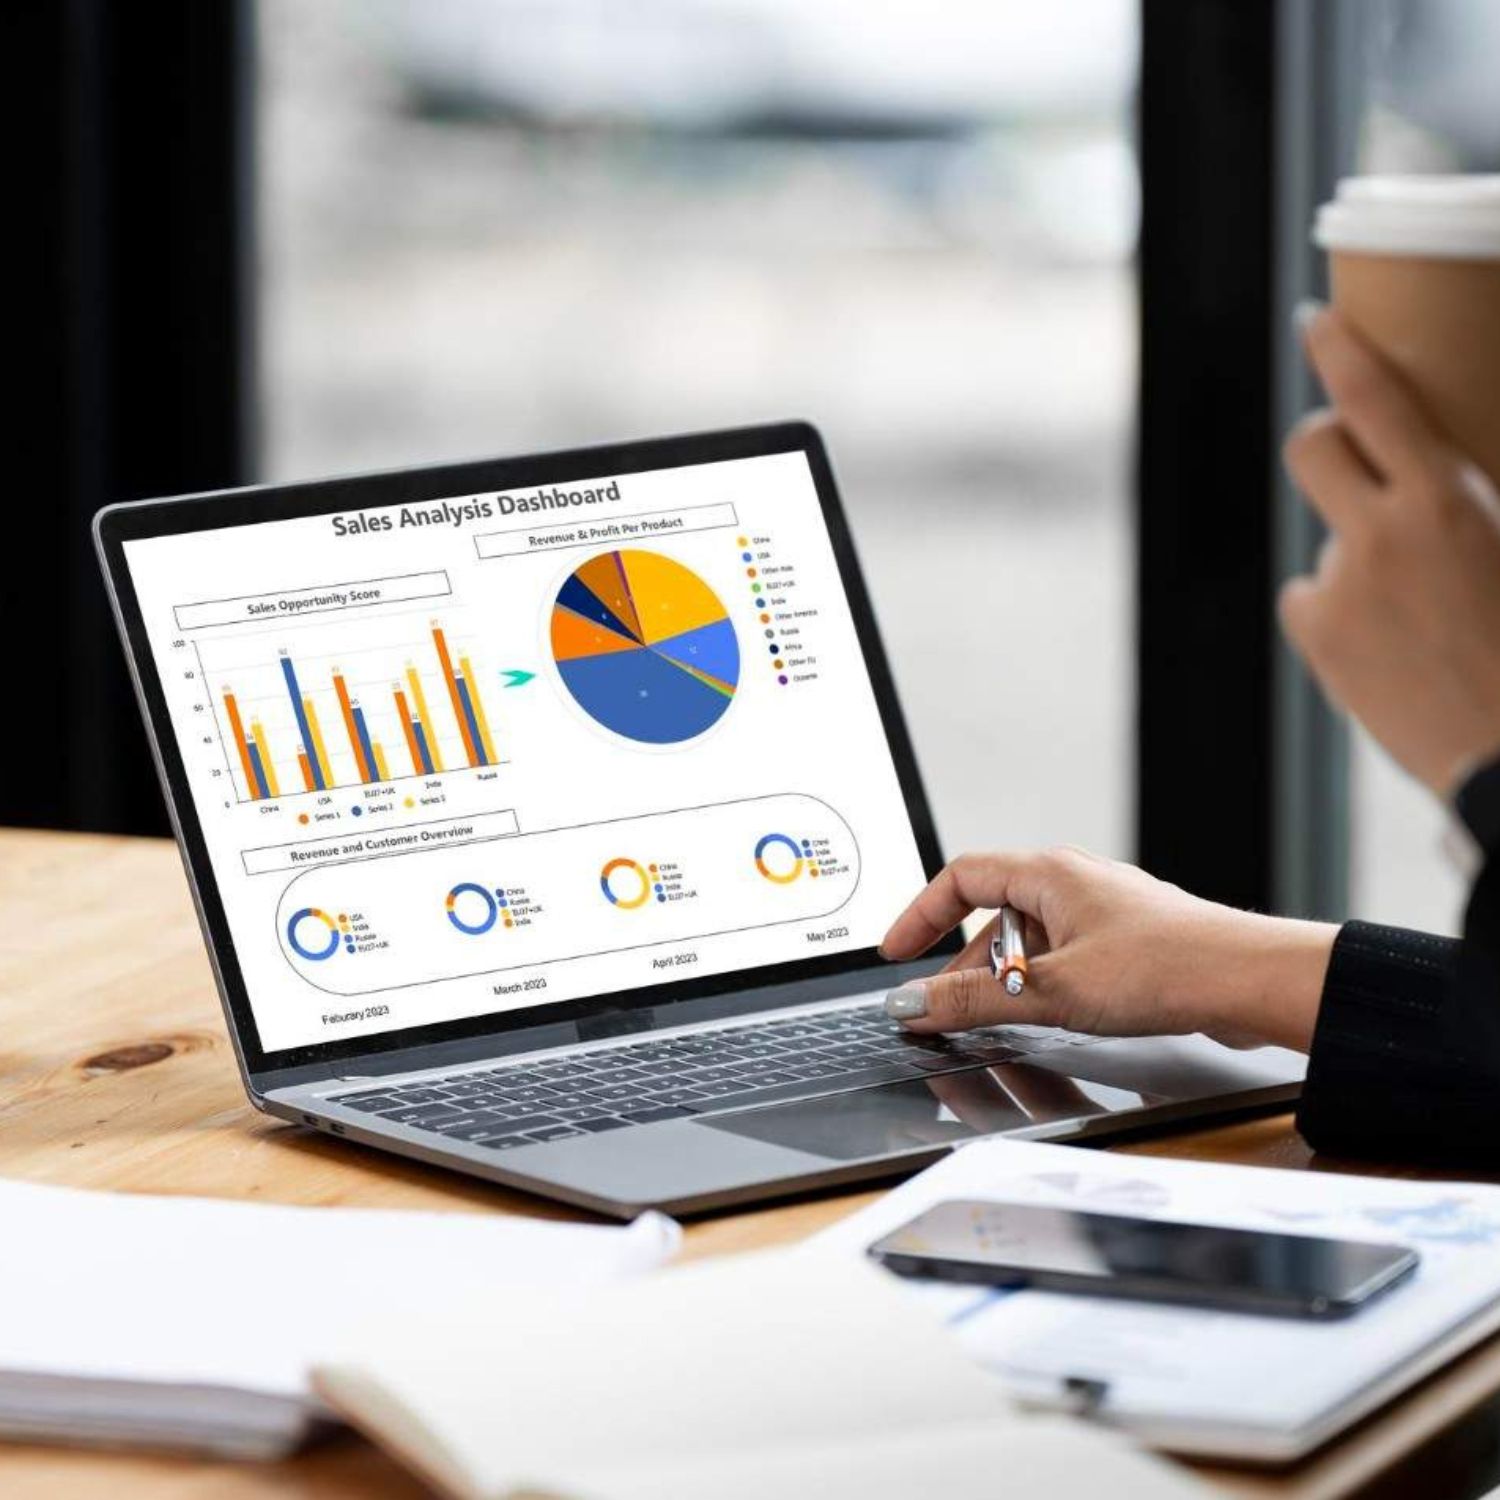
Real-Time Analytics Dashboard

Access real-time insights and KPIs from a centralized dashboard. Monitor lead performance, campaign metrics, and team productivity with live data updates.

Live Metrics

Real-time KPI tracking and performance monitoring.

Interactive Charts

Dynamic visualizations and trend analysis.

Report Export

Customizable Report Builder

Create unlimited custom reports tailored to your business needs. Select from 50+ metrics, apply advanced filters, and visualize data in multiple formats including tables, charts, and graphs.

  • image Drag-and-Drop Builder
  • image Advanced Filtering

Already Join 15K+ Business Using LeadX

Brand
Brand
Brand
Brand
Brand
Brand
Brand
Brand
Brand
Brand
Brand
Brand
Brand
Brand
Brand
Brand
Brand
Brand
Brand
Brand

ANALYTICS FEATURES

Comprehensive Analytics &
Reporting Solutions

Lead Conversion Analysis icon

Lead Conversion Analysis

Track conversion funnels, analyze lead quality, and measure campaign effectiveness with detailed conversion rate metrics and source attribution reporting.

Performance Metrics icon

Performance Metrics

Monitor team performance through call duration, response times, lead handling metrics, and individual agent productivity dashboards.

Predictive Analytics icon

Predictive Analytics

Leverage AI-powered insights to forecast trends, identify high-value leads, and optimize your sales strategy with machine learning predictions.

Campaign Analytics icon

Campaign Analytics

Analyze multi-channel campaign performance including email, SMS, WhatsApp, and voice metrics with ROI tracking and engagement analytics.

Scheduled Reports icon

Automated Report Scheduling

Schedule and automate report generation and delivery. Get reports delivered daily, weekly, or monthly via email in PDF, Excel, or other formats.

How it works

Reports & Analytics in four simple steps

  1. 01

    Collect

    Every lead, message and outcome is tracked automatically.

  2. 02

    Visualise

    Real-time dashboards show what is happening now.

  3. 03

    Compare

    Break results down by source, campaign and rep.

  4. 04

    Act

    Double down on what converts and fix what does not.

Problems solved

What changes with Reports & Analytics

Without LeadX

Reports are built by hand at month end.

With LeadX

Dashboards update in real time.

Without LeadX

Nobody knows which source brings good leads.

With LeadX

Lead source effectiveness is tracked automatically.

Without LeadX

Campaign results are a feeling.

With LeadX

Performance and conversion rates are measured.

Worked example

Reports & Analytics in practice

A manager opens the dashboard on Monday, compares lead sources, and sees that one channel brings fewer leads but more conversions. Budget moves accordingly, and the next report shows the effect.

Who it is for

Sales managersCoach with numbers instead of impressions.
MarketersProve which campaigns earn their budget.
Business ownersSee the health of the pipeline at a glance.
Cta image

Mobile Access to
Your Leads

Stay connected with your leads on the go. Manage conversations, track activities, and never miss an opportunity with our mobile apps.

Our lead management platform is trusted by over
2,000 businesses worldwide

K

Active Users

K

Downloads

%

Automation

INTEGRATIONS

Connect with Your Essential
Business Tools

FAQ

Answers to Your Frequently
Asked Questions

What does Reports & Analytics do in LeadX?
Access powerful analytics and reporting tools with real-time dashboards, customizable reports, conversion tracking, and predictive analytics.
What problems does Reports & Analytics solve?
Dashboards update in real time. Lead source effectiveness is tracked automatically. Performance and conversion rates are measured.
How do I get started with Reports & Analytics?
1. Collect: every lead, message and outcome is tracked automatically. 2. Visualise: real-time dashboards show what is happening now. 3. Compare: break results down by source, campaign and rep. 4. Act: double down on what converts and fix what does not.
Who is Reports & Analytics for?
Sales managers: coach with numbers instead of impressions. Marketers: prove which campaigns earn their budget. Business owners: see the health of the pipeline at a glance.
How does Reports & Analytics fit into the rest of LeadX?
Reports & Analytics works together with LeadX's lead capture, messaging, and automation tools, so your team can manage the full lead lifecycle in one place.
How does the lead capture system work?
You can capture leads through multiple channels including Facebook Lead Ads, website forms, CSV imports, and third-party integrations. All leads are automatically organized with custom fields and segmentation.